

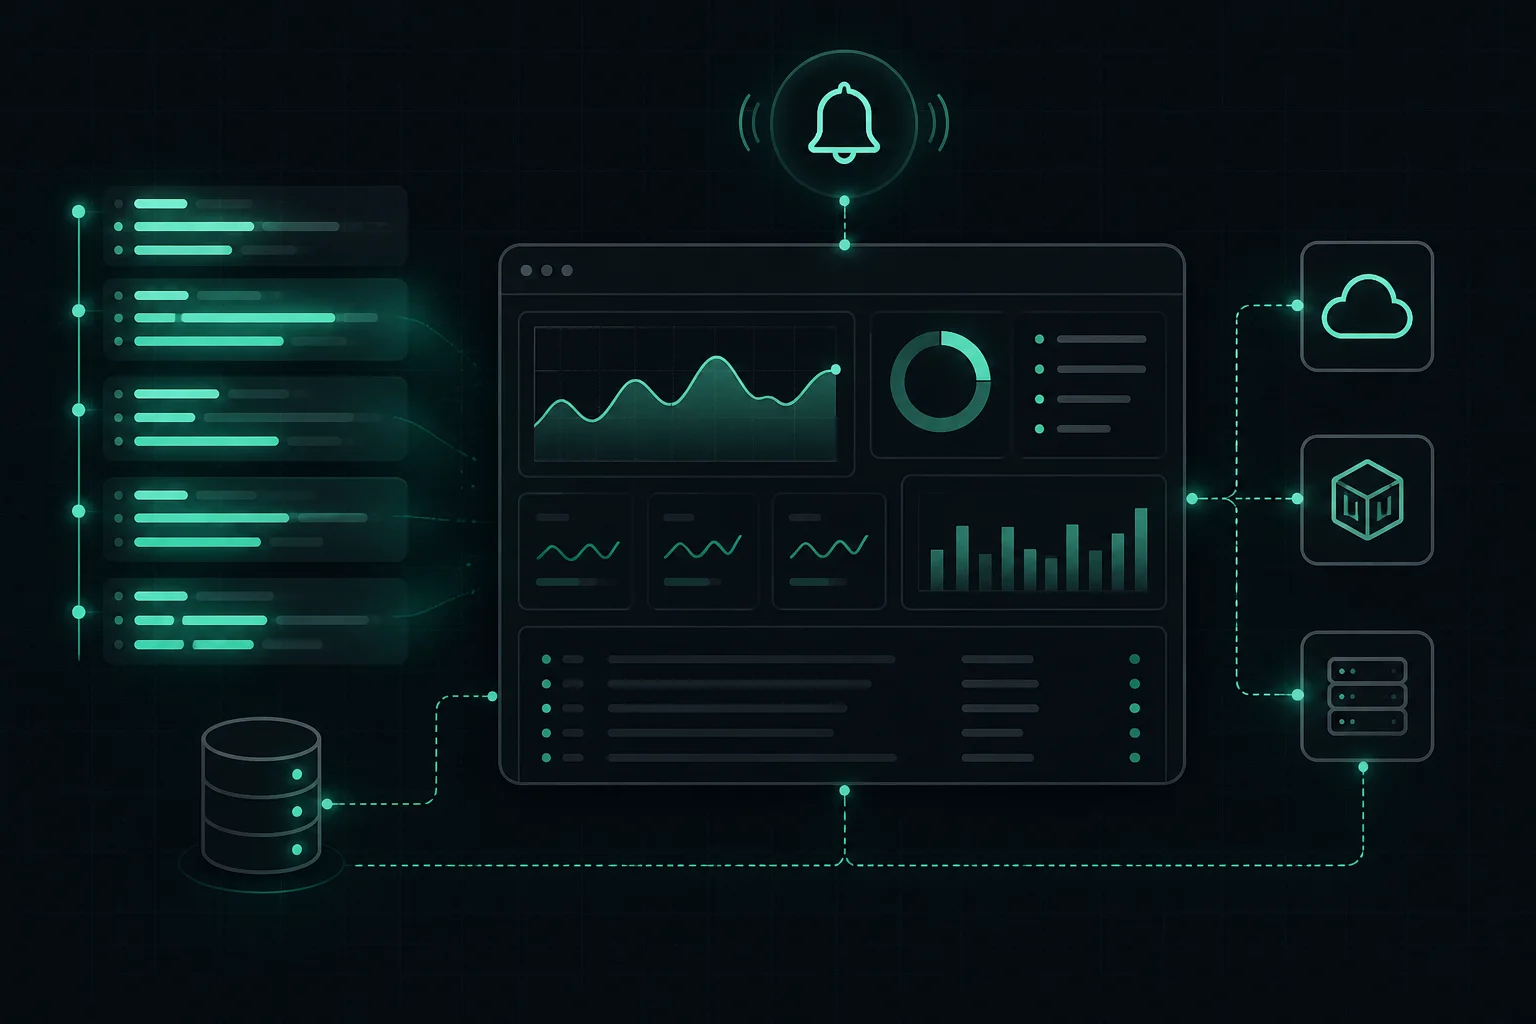
Introduction
Shipping to production is not the finish line. Without logs and monitoring, you discover outages when users do—and debugging takes longer on every runtime (Node, JVM, .NET, Go, PHP, etc.).
Two complementary practices
Logging — persistent records of events, errors, and request traces (structured JSON, plain text, Windows Event Log, journald, …).
Monitoring — metrics and health over time: CPU, memory, latency, error rates, queue depth, saturation.
Together they answer: what broke, when, and under what load?
Universal layers
Client
  → Edge / CDN / load balancer     (access logs, WAF events)
  → Reverse proxy                  (access + error logs)
  → Application runtime            (app logs, APM traces)
  → Database                       (slow queries, connections, storage, replicas)
  → Host or orchestrator           (CPU, RAM, disk, restarts)
Where each line physically lives depends on your setup (VM, K8s, PaaS), but the layers repeat everywhere.
Database: what to watch (local and production)
Local: enough disk for dev data; if you use Docker for Postgres/MySQL, watch container logs and volume size. Wrong connection string usually shows up immediately in the app log (connection refused, auth failed).
Production:
- App logs — connection pool exhausted, timeouts, deadlock messages, ORM errors.
- Engine metrics — CPU, memory, disk (DBs fill disks), replication lag if you use replicas. Managed services expose dashboards (RDS, Cloud SQL, Atlas, etc.).
- Slow query logs — enable and review periodically on self-hosted or managed engines that support them; fixes are often indexes or query shape, not “more servers.”
- Backups and restores — separate from app deploys: schedule automated backups, test a restore occasionally, and keep retention aligned with compliance.
Treat the database as its own failure domain: the app can be healthy while the DB is saturated or unreachable—monitor both.
1. Application logs
Goal: stdout/stderr or a logging library end up somewhere durable and searchable.
| Context | Where logs often go |
|---|---|
| systemd service | journalctl -u myapp -f |
| PM2 (Node) | pm2 logs, files under ~/.pm2/logs/ |
| Docker | docker logs, logging driver → aggregator |
| Cloud PaaS | Provider “Logs” tab / export to vendor |
| .NET / Java | File sinks, OpenTelemetry, Application Insights, etc. |
Rotation matters on VMs: use logrotate, PM2 modules, or platform defaults so disks do not fill.
2. Reverse proxy / edge logs
Whatever terminates HTTP (NGINX, Caddy, Traefik, Apache, ALB, Cloudflare) usually produces access and error logs. Use them for:
- 502/504 — upstream down or timeout
- TLS and SNI issues
- Abuse patterns and bad bots
Paths are product-specific; learn yours once and bookmark them.
3. Process and host health
VM / bare metal:
- CPU and memory:
htop,top, Task Manager,vm_stat, … - Disk:
df -h, volume metrics in cloud consoles - Restart counts from your supervisor (PM2 list,
systemctl status, K8s pod restarts)
Kubernetes: kubectl top, metrics-server, Prometheus.
4. Log rotation (do not skip)
Without rotation, every stack can fill the disk. Configure:
- logrotate for files on disk
- PM2
pm2-logrotateif you use PM2 - Docker logging drivers with size caps
- Cloud defaults—but verify retention meets compliance
5. Advanced: metrics and APM (optional)
When logs alone are not enough, teams add:
- Prometheus + Grafana
- Datadog, New Relic, Honeycomb, Grafana Cloud
- OpenTelemetry for traces across services
Same motivation regardless of language: dashboards, SLOs, alerting.
6. Alerts
Notify people or systems when:
- Health checks fail
- Error rate spikes
- Disk or memory crosses a threshold
- Certificate expiry approaches
Wire alerts through your hosting provider, metrics stack, or CI/CD + cron for synthetic checks.
Debugging patterns (stack-neutral)
| Symptom | First places to look |
|---|---|
| 502 from proxy | Proxy error log + is the app listening? |
| App restarts in a loop | Application error log + supervisor status |
| Slow responses | Metrics (CPU, database wait time / slow queries, external APIs), APM traces |
| Disk full | Logs, temp files, unrotated archives |
Pro tips
- Treat structured logs (JSON fields) as a long-term investment for search.
- Correlate timestamps across proxy and app when chasing a request ID.
- Re-check observability after every production deploy.
- Add alerting before you need it at 3am.
End-to-end picture
Traffic → Edge / proxy logs
       → App logs + metrics
       → Host / cluster health
       → Alerts & dashboards
Conclusion
Monitoring and logging are not NGINX- or Node-specific. They are how you operate any production system. Learn the layers; plug in the tools your stack uses.
Series (same flow, any technology): Environment → Ship code → Supervisor → Proxy & HTTPS → CI/CD → Observe (this guide).